Network Science is the study of two components: nodes and edges. Related nodes are connected by edges and these combinations form a graph. The base of network science is easy to understand but don't be fooled, it is a deeply mathematical field. Network Science PhD programs and deep learning graph libraries have already arrived and there is plenty of room for advances in the field.
When I studied this discipline I had difficulty finding datasets to play with and analyze. This surprised me because a graph files are simple to create and can model a variety of fun relationships. I use Gephi to create graph files by importing a CSV and exporting the resulting output in a format like Graph Modeling Language (GML). Data in this format can be accessed by other graph analysis software. The input CSV file is straightforward to create. The cell entries are nodes. Nodes that appear in the same row will have an edge that connects them.
Image
The main hurdle with making a graph file that is suitable for analysis is not the technical aspect. It lies in finding a subject that lends itself well to the graph format. One of the classic examples is a graph that depicts the relationships between the characters in Victor Hugo's Les Miz. When two characters appear in the same chapter, they are connected by an edge. This works well as a graph file because there are many characters and chapters to create separation. In my first attempts at creating a analyzable graph file there were either too few nodes overall or they all interacted too often so there was no meaningful distinctions in the graph.
After some thought I remembered a subject I believed would make for an interesting graph file: the documents of Founders Online. The website archives over 184,000 writings of historical American figures from the Founding era. For the purpose of creating a graph file, I want the correspondence sent among the founders. This will be a directed graph where the source node is the author and the target node is the recipient.
The API page provided a good starting point with the full metadata in JSON format. From here I have creative freedom to extract the relevevant entries and transform them into the CSV format to be used by Gephi. I parsed through the JSON file and extracted the authors and recipients from each entry and placed them into a list of dictionaries. While parsing I removed entries with multiple recipients or another issue like an anonymous author or letters without a recipient. Next I wrote the list of dictionaries to a CSV file. The Python code I wrote to transform the data is short and can be found at my GitHub.
Image
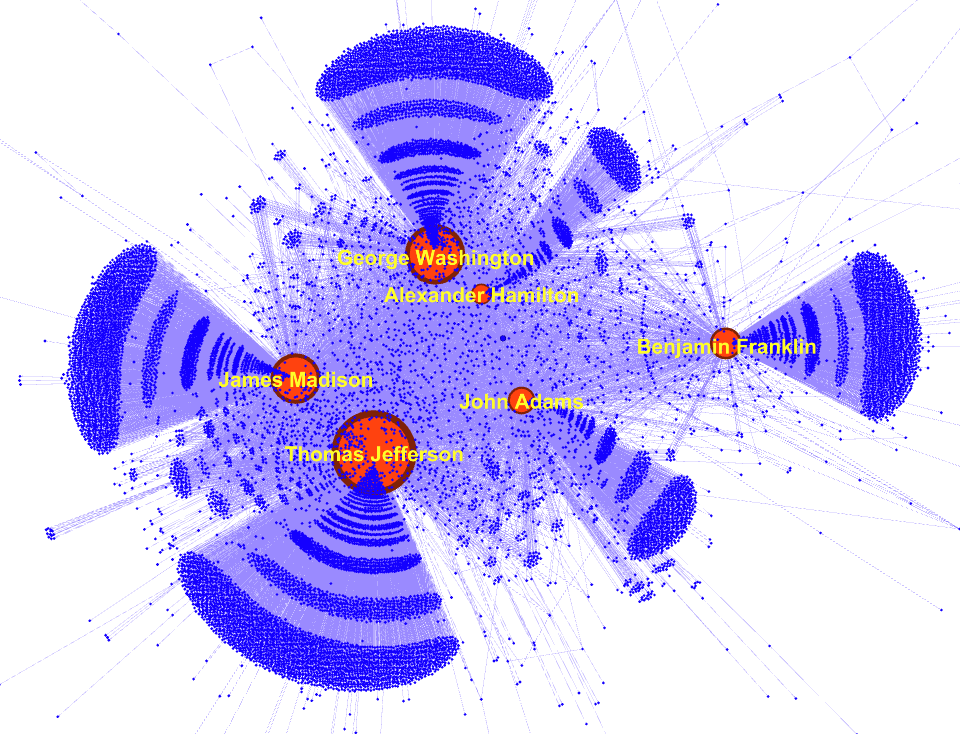
Its time to load the transformed data into Gephi and begin analyzing the network. Gephi will take the entire output CSV file and display the network as a big loaf of tofu on the screen. In order to make the network interpretable I applied layout and sizing effects. Yifan Hu and Force Atlas are my go to layouts for networks with tens of thousands of nodes. As is the case with many networks, the majority of connections belong to a small number of entities. The result is cones of nodes that lead to the most prolific authors who in this case, are also the most popular recipients.
Visualizing this graph allowed me to better understand the communication patterns of the Founding era. I hope this will inspire you to build your own network science file. You can find the GML file on this Kaggle page.