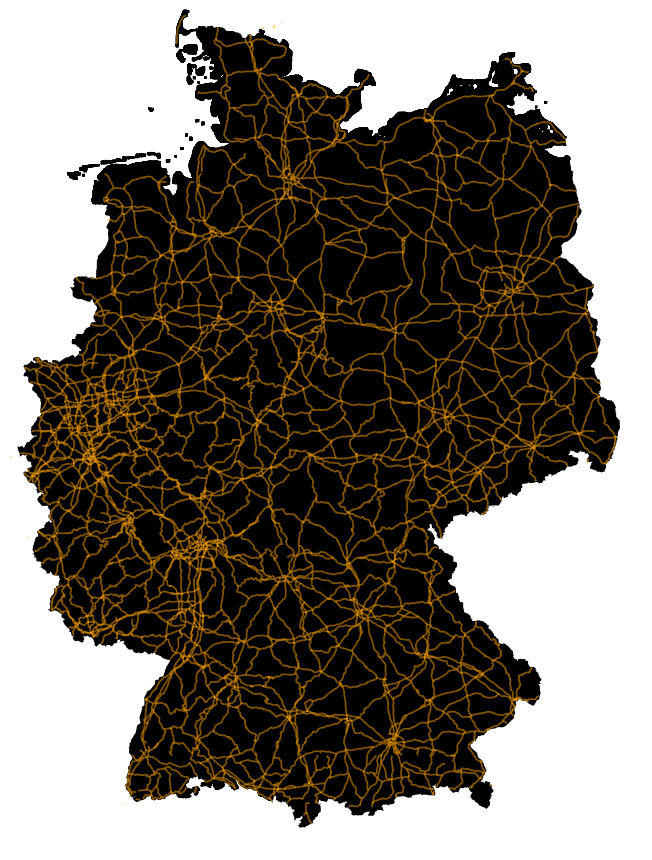
D3.js is a powerful data visualization library that displays graphics right in your browser. It can consume geographic information which is widely available these days. With some additional data, D3 can make compelling geovisualizations like choropleths, and dot density maps.
Preparing the Data
There is a lot of spatial data that is free to use on the internet. For this post I am using the free country level data provided by DIVA-GIS. Spatial data is often separated into a few components then compressed into a zip file. D3 cannot work with the data in this format.
Thankfully there are tools online that convert spatial data zip files to GeoJSON, a format that is D3 friendly. My go to is Mapshaper. Import the entire zip file. Mapshaper has a simplify feature which makes the file smaller but the lines less precise. I like to play with it and pretend I'm making minimalist art or something. Anyways when you're finished export the data as a GeoJSON file.
Display the Spatial Data
Projections make it possible to display a 3D object on a 2D surface. There are a handful of projections each with their strengths and differences. GeoJSON coordinates can be transformed by a projection function then displayed using a line generator.
Get the GML file from my Git Hub